
RFMapper Desktop Analysis
A survey-to-report system for mobile coverage assessment — collect RF logs in the field, analyse them against every carrier, and generate the client report.
Overview
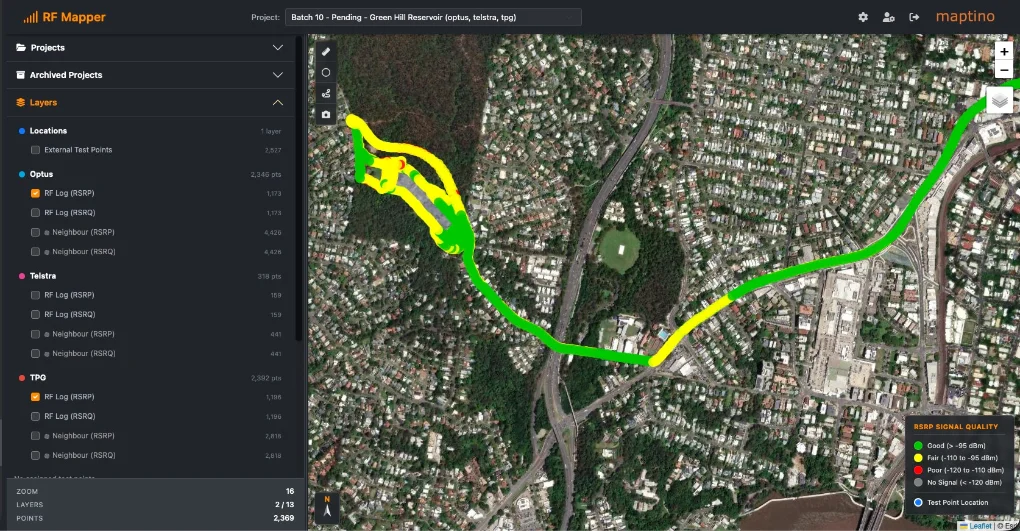
Assessing whether a site or a road has usable mobile service normally means a day in the field followed by a week in Excel. RF Mapper closes that gap. Field logs from three phones — one per carrier — are dropped into a project, and the system splits them by network, classifies every point against RSRP thresholds, and puts them on an interactive map alongside carrier tower locations and each carrier’s own published coverage.
From there it finds the things that actually matter to a client: the stretches where every carrier fails at once, the individual locations that fall below the emergency-call threshold, and which carrier to put the fleet’s SIMs on. Drop-out zones are snapped to real road names from OpenStreetMap and tied to the nearest named landmark. The output is a finished Word report in corporate format — not a data dump. Two report types are supported: fixed facility assessments and vehicle drive routes.
Capabilities
- Projects. Upload, merge, rename, archive and restore field-survey datasets.
- Automatic carrier splitting. One combined log in, per-carrier datasets out — with emergency-fallback readings correctly attributed to the phone’s home network rather than the network it borrowed.
- Interactive map. Signal level, signal quality, no-service points, neighbour cells and legacy 3G/2G fallback samples, layered per carrier.
- Carrier sites. Tower locations and labels overlaid on the survey data.
- Published coverage. Each carrier’s advertised 4G and 5G footprint, loaded per viewport, for comparing claimed against measured.
- Drop-out zones. Contiguous stretches where every carrier fails, with road names and nearest landmarks resolved automatically.
- Emergency-critical locations. Individual points where no carrier meets the emergency-call signal threshold, flagged as their own map layer.
- Test points. Promote any measurement to a labelled, reportable test location.
- Map export. Publication-ready PNG with legend, north arrow and numbered markers.
- Report generation. Formatted Word documents in corporate house style, in facility or drive-route format.
- Processing logs. Full visibility of what the ingest pipeline did to each file.
Under the hood
The carrier-attribution problem is the interesting one: when a phone loses its home network it camps on a competitor’s for emergency calls, and naive processing files those readings under the competitor — flattering the borrowed network while hiding the coverage hole on the one that failed. The splitter tracks each device’s home network and keeps the reading where it belongs, recorded as a loss of service. It also degrades gracefully on bad input: where timestamps have been corrupted, drop-out detection falls back to a position-and-distance method rather than silently producing zeroes, with the affected columns dropped from the report and footnoted. Runs as a self-hosted web application; the ingest pipeline is a watched folder, so field logs can be dropped in without going through the browser.
Field data is collected with a companion Android logging app. Built on Leaflet for mapping; drop-out zone road naming uses OpenStreetMap data (ODbL). Report generation uses the docx library. Basemap imagery is supplied by the configured tile provider and carries its own attribution.
Maptino Drive Test
Professional-grade RF capture from an unrooted Android — 5G NR, LTE, roaming and satellite NTN, logged and uploaded automatically.
RFMapper Drive Planner — Tablet Edition
Plan the drive test, drive it, and survey the buildings at either end — OpenStreetMap route plans to KML/CSV export.
Want a demo, a licence, or a survey done?
One email covers all of it — tell us the tool or the job, and the region.