
Connectivity analysis for councils and government bodies
Every premises scored for mobile and broadband coverage, ranked worst-first and mapped — the black-spot evidence a Mobile Black Spot or Regional Connectivity Program application needs, and the one consistent method a program office needs to assess them. For councils, departments, regional bodies and the advisers who work for them.
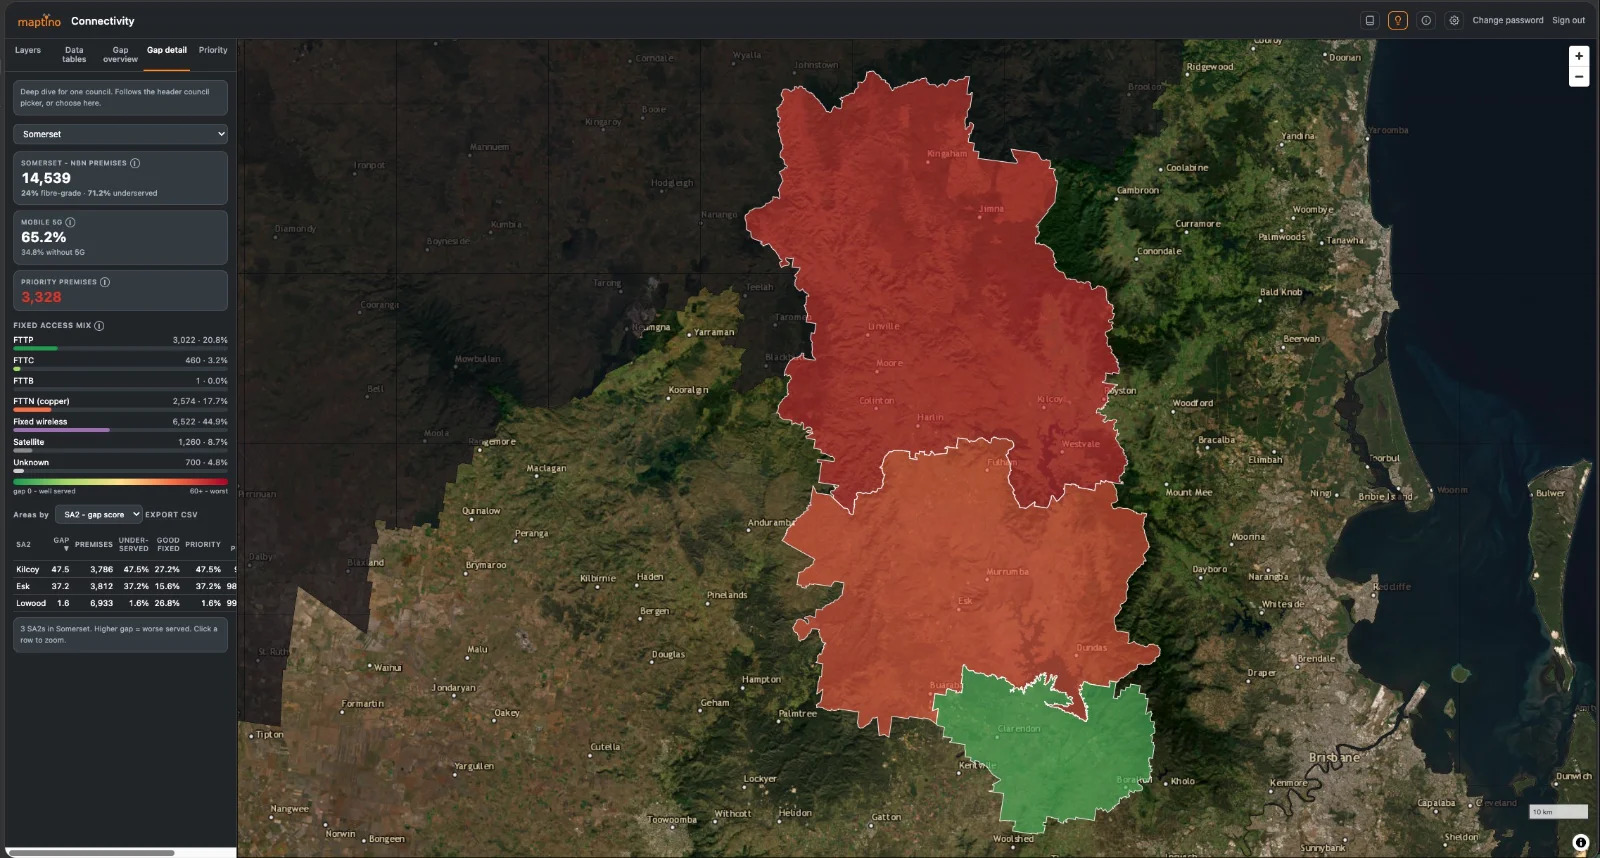
The problem with the coverage map
Carrier coverage maps are polygons drawn over terrain. A grant assessor wants to know which houses, which farms, which road and which school have no usable service — and how many people that is. A shaded polygon can’t answer that, and neither can a resident survey with forty responses.
Councils endorsing projects under the Regional Connectivity Program, or making the case for a Mobile Black Spot Program site, are asked for place-based evidence: where the gap is, who it affects, and why this location over the next one. Producing that from scratch is weeks of GIS work most councils don’t have spare.
What Maptino Connectivity gives you
- Every premises, not a polygon. Fixed and mobile coverage resolved to individual addresses across the whole LGA — or the whole state.
- A single 0–100 score per property, consistent across the region, so two towns can be compared honestly.
- Ranked worst-first. The list your application needs, already sorted.
- Tunable priorities. Weight severity, scale or coverage type to match the program guidelines you’re applying under — re-rank live.
- Layered context. Overlay roads, facilities, LGA and postcode boundaries, and the carrier’s own published footprint to show claimed versus real.
- Exports built for submissions. CSV tables, PNG and PDF map views with legends — drop them straight into the application.
- Hosted in Australia. Operated by Maptino on Sydney infrastructure, or delivered as a service if you’d rather we run the analysis for you.
Built for the application
Regional Connectivity Program Round 3 is funding place-based broadband and mobile solutions, with councils endorsing projects as local priorities. The Mobile Black Spot Program has funded over 1,200 base stations across seven rounds, each one argued for with evidence.
Maptino Connectivity produces that evidence in the form assessors expect: a defensible, repeatable, whole-of-LGA view, with the methodology documented so it holds up to scrutiny.
Sixty councils, one method
Every council can make a case for its own black spots. A state program office has to rank them against each other, and the evidence arrives in sixty different formats, from sixty different methods, none of them comparable. The usual result is a prioritisation that can’t be defended when the council that missed out asks why.
Maptino Connectivity scores every premises in the state on the same 0–100 scale, from the same data, with the same documented method. Two towns three hundred kilometres apart can be compared honestly. Weightings — severity, scale, coverage type, service criticality — are tunable to the program’s own criteria, and the ranking re-runs live when they change.
Assessing, not just applying
The same tool that helps a council build an application helps an assessor test one. Overlay the applicant’s claimed gap against each carrier’s published footprint and against measured drive-test data; see the premises count behind the claim; check whether the proposed site closes the gap or just moves it. Independent of any carrier, and independent of the applicant.
Maptino also works alongside program offices, applicants and their advisers directly. For a department or agency, that means assessment support — an independent read of the evidence behind each application, on one method, across a whole round. For a council, regional development body or any government entity preparing a submission, it means the analysis, maps and written methodology produced with them, by an engineer who has built the evidence base before. Consultancies and advisers acting for a government client can commission the same work under their own engagement. Tool licence or delivered service — see Services.
One method, any boundary
The scoring doesn’t change with the boundary, and neither does the audience. The same premises-level method reports at national, state and LGA level, and keeps going below the LGA — to postcode and down to SA1, the finest statistical area the ABS publishes — or against another defined area of interest such as a corridor, a program footprint or a region. A federal assessor comparing applications from three states, a state program office ranking sixty councils, a regional development body making its case, and the consultancy advising any of them are looking at the same numbers, computed the same way, so results carry across programs and across rounds without being rebuilt for each one.
Beyond coverage maps
Coverage is the input; the decisions are about service. The same premises-level data answers where emergency warnings won’t reach, which highway stretches have no service for a breakdown call, and which communities can’t sustain telehealth or remote learning — as layers, with the count of people behind each one.
Verified in the field
Where a modelled gap is contested — by a carrier, an applicant or a member — Maptino’s drive-test tools produce measured signal from a standard Android phone and a report that stands on its own. Modelled and measured, one workflow. See Drive Test and Desktop Analysis.
Hosting and sovereignty
Runs on infrastructure Maptino operates in Australia — Akamai Cloud (Linode), Sydney region. Data held there stays onshore and is not replicated offshore. The provider holds ISO/IEC 27001 and SOC 2 attestations at the infrastructure level; Maptino itself holds no security certification, and does not claim one. Where a program requires a specific hosting standard, the deployment can be moved to infrastructure that meets it.
Proof of scale
Deployed across 1.6 million premises and 11 local government areas in a single deployment, resolving to individual properties.
Frequently asked questions
- Which coverage data does it use?
- Publicly available mobile and broadband coverage data, combined with your own datasets where you have them — survey results, complaint logs, asset registers. We walk through the specific sources in conversation.
- Can it produce the material for a Regional Connectivity Program or Mobile Black Spot application?
- Yes — ranked premises lists, maps with legends and a written methodology are standard exports.
- Can we assess applications with it as well as build them?
- Yes — see “Assessing, not just applying” above.
- Can it run at state scale?
- It has run across 1.6 million premises and 11 LGAs in one deployment. Going to whole-of-state is a compute question, not a change in method — additional areas are added as and when a program needs them.
- Is the method documented for audit?
- Yes — the scoring criteria, weightings and data sources are exported with every result.
- Does it need our GIS team?
- No. It’s a web application. Imports take CSV, XLSX, GeoJSON, KML or KMZ.
- Where is the data hosted?
- In Australia, on infrastructure Maptino operates — Akamai Cloud (Linode), Sydney region. Never offshore.
- What does it cost?
- Priced for councils and agencies, not carriers. Enquire with your area and premises count.
Maptino Connectivity
See exactly where connectivity fails, and who it fails — gaps mapped to the premises.
Maptino Drive Test
Professional-grade RF capture from an unrooted Android — 5G NR, LTE, roaming and satellite NTN.
RFMapper Desktop Analysis
Import survey logs, split by carrier, map coverage, find drop-out zones and generate the client report.
Maptino Facilities Management Assessments
Map and grade vertical assets, and run the whole carrier access process in one place.
Working on a grant round, a connectivity strategy or a program?
You’ll get a reply from the engineer who built the tool.