
Maptino Connectivity
See exactly where connectivity fails, and who it fails.
Overview
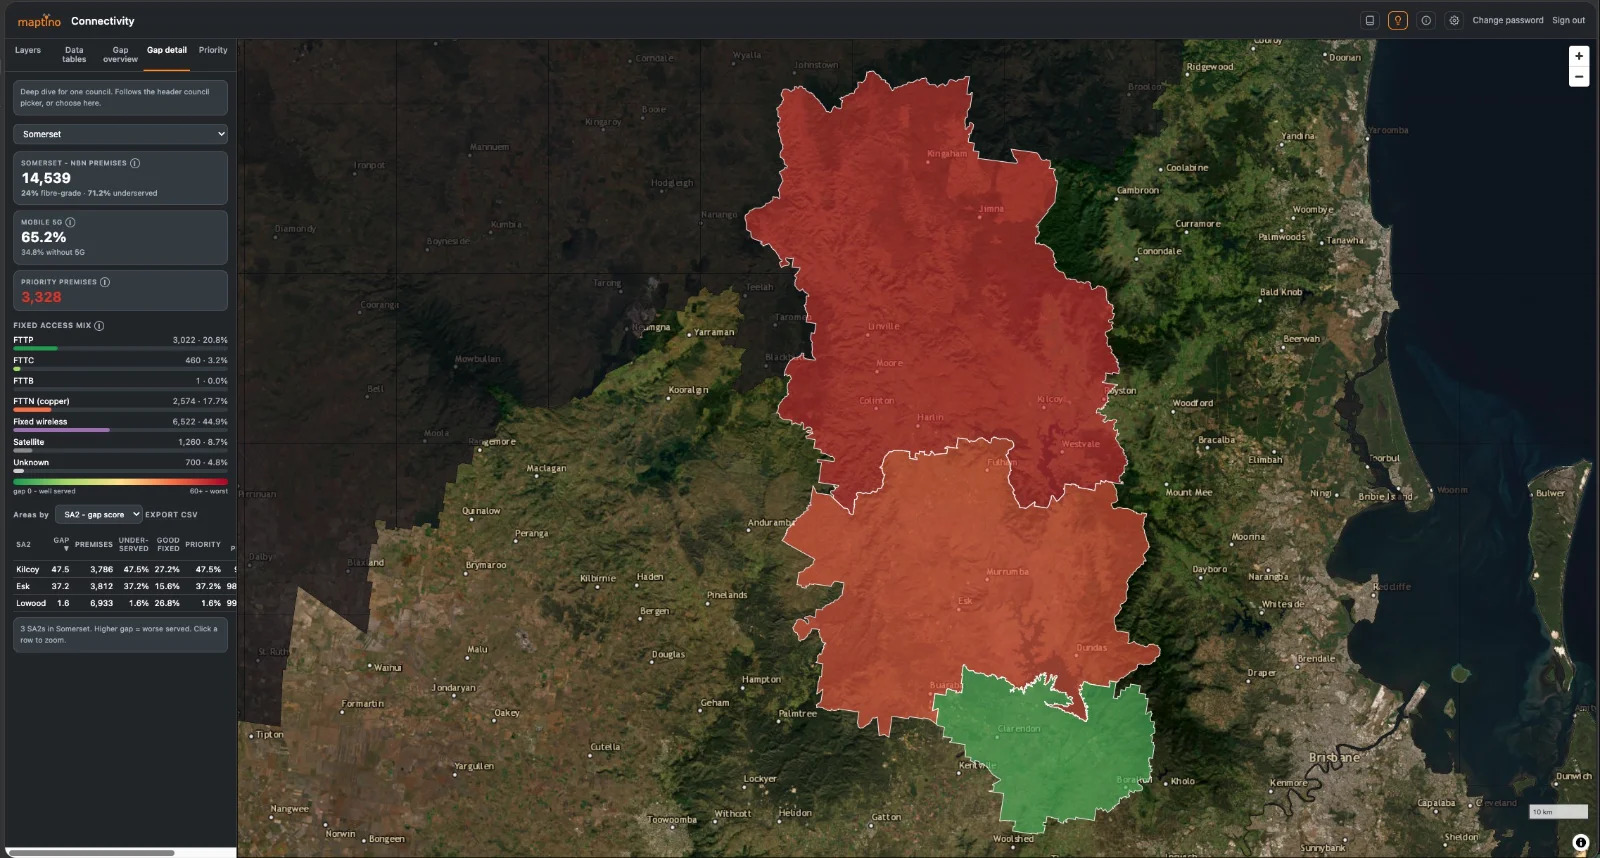
Most connectivity reporting stops at a percentage. A council is told it has 94% coverage and is left with no idea which streets make up the other 6%, or whether those premises are about to be upgraded anyway. Maptino Connectivity answers the question underneath: it combines fixed-line technology records, mobile coverage as reported by the carriers, and published upgrade plans, and resolves them down to individual premises.
The result is a map where you can select any neighbourhood and see the affected properties themselves — not a shaded polygon, the actual points. A percentage invites argument. A map of 1,800 specific premises with no fibre, no 5G and no upgrade scheduled does not.
Capabilities
- Premises-level detail. Select a statistical area and the affected properties appear on the map, with a count that matches the reported figure.
- Consistent scoring. Every area scored 0–100 on the same basis, so areas of different sizes compare honestly.
- Ranked automatically. The worst-served areas surface without manual analysis.
- Tunable prioritisation. Weight severity, scale and coverage to match your funding criteria; the shortlist re-ranks in real time.
- Layered context. Infrastructure, community facilities, land use, planning overlays and hazard data alongside the connectivity picture.
- Exports. Any table to CSV, any view to PNG or PDF with a legend.
- Built-in explanations. Every measure carries a plain-English note on how it is derived and what it does not tell you.
- Runs anywhere. A single container on your own cloud or on-premises server. No data leaves your environment.
- Works on restricted networks. If background map imagery is blocked by a firewall, the platform says so and keeps working — every data layer continues to function. Air-gap compatible.
Proof of scale
Currently deployed across a region of 1.6 million premises and 11 local government areas, resolving to individual properties, running as a single self-hosted container.
Who it is for
Local and regional government (grant submissions, defensible prioritisation) · state agencies and regional development bodies (consistent cross-LGA comparison) · network operators and infrastructure builders (genuinely unmet demand) · consultancies (a delivered evidence base) · utilities and asset owners (assets relative to gaps).
Built by Kevin Biles Consulting Pty Ltd trading as Maptino. Uses OpenStreetMap data (© OpenStreetMap contributors, ODbL) for basemaps and points of interest, and Australian Bureau of Statistics ASGS 2021 boundaries (CC BY 4.0) for LGA, postcode and statistical area imports. Full third-party attributions are listed in the application’s licence panel.
Want a demo, a licence, or a survey done?
One email covers all of it — tell us the tool or the job, and the region.